Understanding Your Child's Evaluation Report: Scores, Percentiles and What They Mean
Your child's evaluation report uses scores to compare performance in specific areas, such as reading, language or attention, against a large group of same-age peers called the norm group. The most common numbers you will see are the standard score, which places your child on a 100-point average scale, plus the percentile rank, which shows the percentage of that peer group your child's score matched or beat. Neither number stands alone. Federal law requires the evaluation to use a variety of tools and multiple sources of information, so the report and the scores in it are one part of a bigger picture the team uses to decide eligibility and write goals.
What is actually in the report
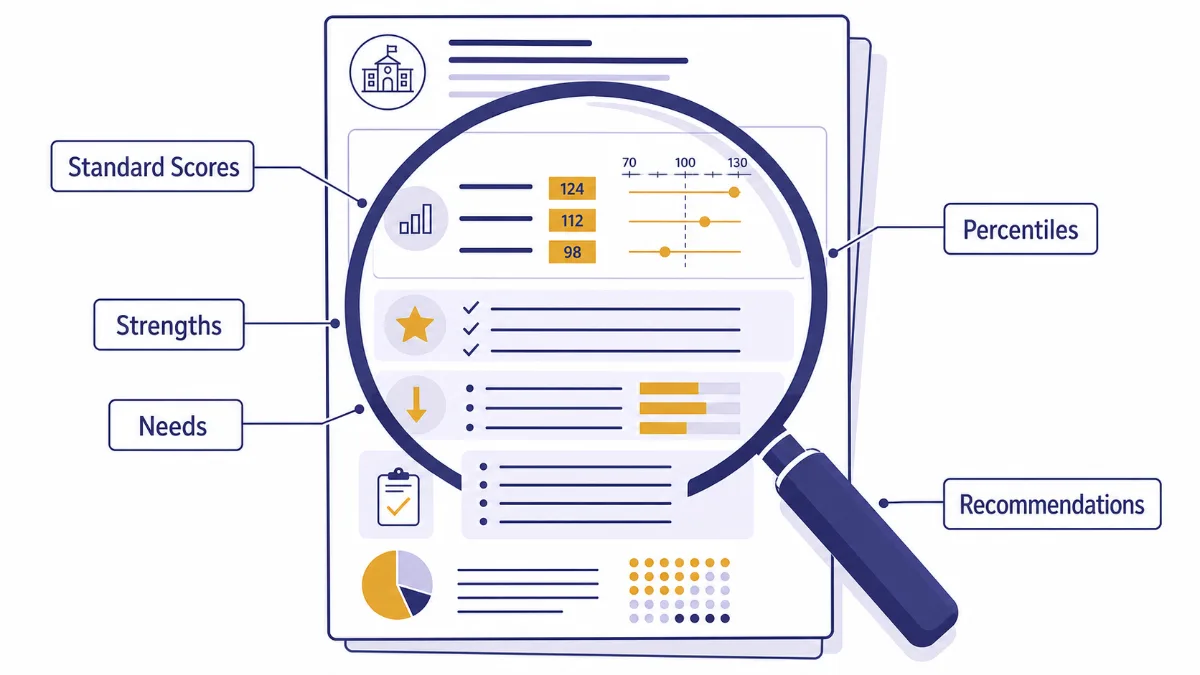
A full evaluation report includes background information, the tools used, the scores from each area tested, a narrative explaining what the scores mean and recommendations.
A typical report opens with background information about your child, then describes the specific tools used, before moving into the scores from each area tested and a narrative section that explains what the evaluator observed during testing, not just the final numbers. Recommendations usually close the report.
The narrative sections are often as useful as the scores themselves. They describe how your child approached each task, where attention or effort might have affected a result and what the evaluator thinks the pattern of scores means in practice, context a number alone cannot carry.
How scores get built: the norm group
Most tests compare your child's raw performance against a large sample of same-age or same-grade peers, called the norm group, then convert that into a standard score or percentile rank.
Most tests used in school evaluations compare your child's raw performance against a large sample of same-age or same-grade peers, called the norm group. Your child's raw score, the number of items answered correctly, gets converted into a standard score or percentile rank based on where it falls inside that comparison group.
This is why the same underlying skill level can produce different-looking scores on two different tests: the norm group, the scale and the specific items differ from test to test. Comparing scores across two different tests works better as a rough pattern check than as a precise one-to-one comparison.
Standard scores, percentile ranks and the other numbers you will see
A standard score is built on a 100-point average scale. A percentile rank shows where your child's score falls in the peer group. Composite, subtest and confidence-interval numbers each answer a different question.
A standard score is built on a scale most often centered at 100, with a standard deviation of 15 on tests constructed this way. Scores from about 85 to 115 usually fall in the average range. A score well below 85 or well above 115 shows a bigger gap from the average, in either direction. A percentile rank shows the percentage of the norm group your child's score matched or outperformed: a percentile rank of 50 is exactly average. A percentile rank of 10 means your child scored as well as or better than about 10 percent of same-age peers and lower than about 90 percent of them.
A composite score combines several subtests that measure related skills, such as a reading composite built from separate decoding, fluency and comprehension subtests. Looking at the subtests underneath a composite often shows exactly where a strength or a struggle sits, rather than just the average of everything together. A confidence interval is a range around the reported score, not a single fixed number, reflecting normal measurement error: a score reported with a 95 percent confidence interval means the evaluator is confident the true score falls somewhere in that range most of the time, even though testing again on a different day could shift the exact number slightly. An age or grade equivalent expresses a score as the age or grade level at which the average child earns that same raw score. These numbers are easy to misread, since a grade equivalent is not the same as saying a child is ready for grade-level work. Most evaluators recommend leaning on the standard score and percentile rank instead.
Reading one paragraph of the report closely
Most of a report’s meaning sits in the way the narrative and the score table qualify each other, which is easier to see on one worked paragraph than in the abstract.
Reports differ from district to district, but the shape of a paragraph rarely does. Below is a composed example written in the style most reports use, followed by what each part is telling you. It describes no real child. It is a pattern to read your own report against.
What the report says: On the Word Reading subtest, [Student] earned a standard score of 78 (7th percentile, 95 percent confidence interval 73 to 83). Testing was completed across two sessions at [Student]’s request. Rate of work was slow and deliberate, with frequent self-correction on multisyllabic words.
What that means: the standard score of 78 sits below the average band of roughly 85 to 115. The 7th percentile says the score matched or beat about 7 percent of the same-age comparison group. The confidence interval is the part most readers skip. It says the true score most likely falls somewhere between 73 and 83, so a cutoff sitting at 80 is close enough to be worth asking about rather than treating as settled. The last sentence is not decoration either. Slow, deliberate work with frequent self-correction on longer words describes a reader working hard at decoding, which is a different picture from a reader guessing. That is exactly the kind of observation that shapes what a goal should target.
What the report says: These results should be interpreted in the context of [Student]’s reported difficulty sustaining attention during extended tasks.
What that means: the evaluator is telling you the number may understate the skill. The score and the conditions it was earned under belong together. A qualifying sentence like this one is worth asking about directly, because it often carries more of the evaluator’s real judgment than the score table does.
Two habits make the whole report easier. Read the narrative first and the score table second, so the numbers arrive with their context already attached. Then mark every sentence you would want explained and bring that list to the meeting, since the evaluator is the person who can answer it and the meeting is where they are in the room.
Why a gap between areas often matters more than any single number
A single low score rarely tells the full story. The gap between areas often points more directly to what kind of support will help.
Evaluators often pay close attention to the gap between areas rather than any one score in isolation. A child who scores strong on reasoning but noticeably lower on processing speed may understand the material but run out of time on timed work. A child with strong verbal skills but a lower working memory score may follow a conversation easily but lose track of a multi-step direction.
These patterns often point more directly to what kind of support will actually help than any single score does on its own, which is part of why the full narrative matters as much as the score table.
Why one score, or one test, never decides anything alone
Federal evaluation rules exist specifically to prevent a single test from deciding eligibility or a program on its own.
The school must use a variety of assessment tools and strategies to gather relevant functional, developmental and academic information. It cannot use any single measure or assessment as the sole criterion for deciding whether a child has a disability or for planning an appropriate program (34 CFR 300.304(b)). The eligibility group has to draw on multiple sources, including test scores, teacher input, your own observations at home and your child's day to day functioning, then document how all of that was weighed together (34 CFR 300.306(a)(1)).
A strong score in one area does not rule out a real need in another. A low score on one measure is never the whole picture by itself. That is the exact reason the law requires more than one tool and more than one source of information before any decision gets made.
Turning scores into goals and services
The evaluation is the foundation the IEP goals are built on. A subtest showing a specific, narrow gap often points directly to the goal's baseline.
A subtest that shows a specific, narrow gap, such as decoding versus comprehension in reading, often points directly to the skill a goal should target and the baseline that goal starts from. A measurable annual goal has to name a baseline and a way to measure progress (34 CFR 300.320(a)(2)-(3)). Evaluation data like this is exactly where that baseline comes from.
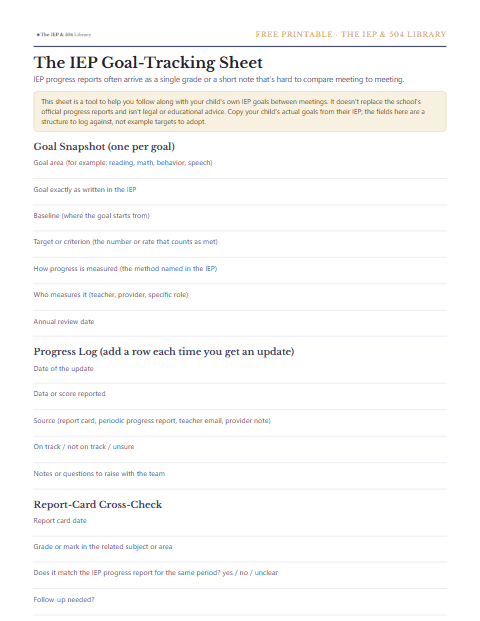
This is also where the report connects back to the goal-bank guides on this site, since a measurable goal for reading, writing, math or another area is meant to be shaped from evidence like the specific pattern in your child's own evaluation, not written from a generic template.
Questions worth bringing back to the team
Ask the evaluator to walk through any surprising score, what test produced it and how it translates into the goals and services being proposed.
It helps to ask the evaluator or the team to walk through any score that surprised you, explain what specific test produced it and describe the norm group it was compared against. Asking what the confidence interval was for a key score is also worth doing, since a single point difference near a cutoff can matter less than it looks.
It is also worth asking directly how the specific scores in the report translate into the goals and services being proposed, so the line between the data and the plan is clear rather than assumed.

From the team behind this library
The IEP & 504 Command Center
This page shows the options to discuss. The Command Center hands you the done pieces: the binder built, the letters written, the meeting scripts ready and a self-review that shows where your child's plan is strong or thin. The library stays free.